
Biosphere 2 Ecosystems
Tropical Rain Forest
Biosphere 2's rain forest has a surface of 20,000 sq. ft. and is modeled principally on the Amazon Basin. It's plants can range from 74-80 ft tall, tall enough to hit the glass inside of the rain forest pyramid. When it was first populated with plants before the first crewed mission, over 400 species of plants including 2,800 individual plants were introduced from Puerto Rico, Belize, Venezuela and Brazil. They added so many species of plants knowing that over time there would be species loss due to competition and stress. Research in the rain forest focuses on the interaction between plants, gases in the air and water. The aim is to better understand how rain forest plants process and release these gases under changing atmospheric conditions and how plants may adjust their water uptake strategies through a controlled drought. What is learned here could have significant implications of how we predict climate change impacts ecosystems.
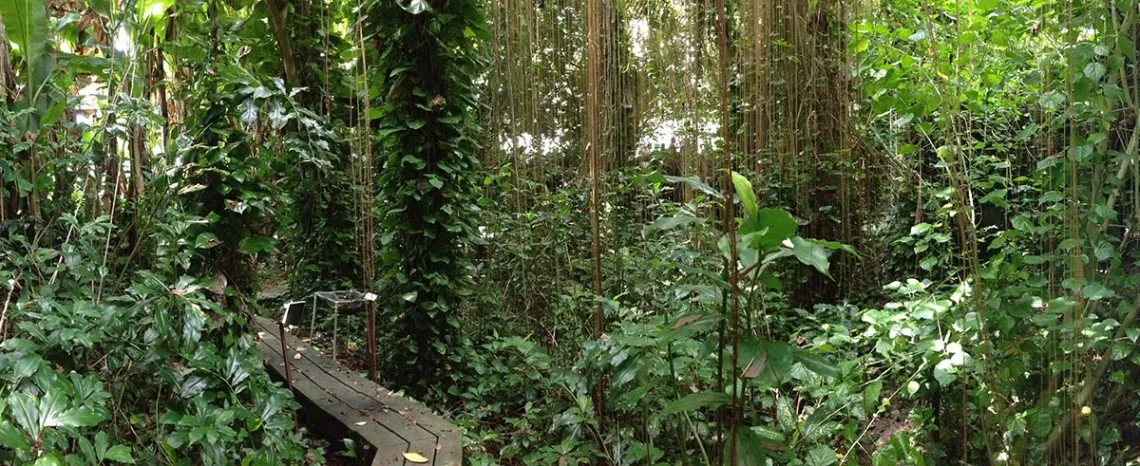
Today, the rain forest has about 100 species of plants and a few animals, with the majority being insects such as ants, cockroaches, snails, and spiders. The dominant species of plants has changed since initial assembly due to both managerial and ecological factors. One managerial influence occurred in the early years; Leucaena leucocephala, a fast growing legume tree species, was planted throughout the biome to shade the newly planted seedlings. This species was removed in early 1994 to give room for other tree species. Recently, our team has been adding new plants such as coffee and cocoa. The soils in the biome are synthesized from local material with textures ranging from sandy loam to clayey loam. In profile, the soils contain a top soil layer which is usually less than one meter thick and subsoil which consists of gravelly granite material.
The Rainforest mesocosm, at the north end of Biosphere 2, was created to simulate several tropical Rainforest habitats. The biome can be divided into the following habitats:
- Lowland rainforest includes most of the eastern part of the biome. It is dominated by large trees with a ground layer of aroids.
- Terraces surround the east, west and north sides of the central "mountain." Small trees including papaya, coffee, and palms are in these areas.
- Ginger belts contain fast-growing large monocots such as banana, gingers, and bird-of-paradise to reduce lateral radiation from outside.
- Bamboo belt of dense bamboo species was intended to screen the biome from airborne salt that might be entrained from the ocean biome.
- Varzea, intended to simulate an Amazonian seasonal floodplain, is located in the southwest corner of the biome.
- Tepui (Cloud forest) was designed to simulate a highland cloud forest. Due to high temperatures vegetation evolved into a marsh dominated by umbrella sedge and morning glory vines.
Learn More About Current Rain Forest Research
Ocean
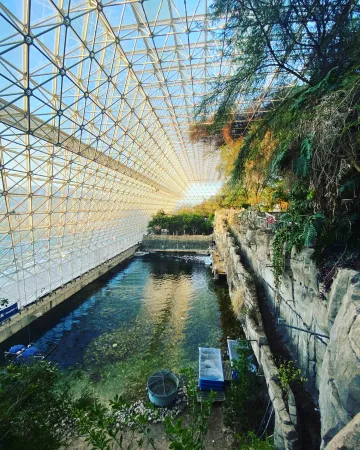
The Biosphere 2 Marine Mesocosm is a complete ocean system originally designed to simulate a Caribbean reef. It is the world’s largest enclosed mesocosm dedicated to innovative research and education on coral reef resilience, with a surface area of 35x20 meters and a volume of 2.6 million liters. The 7-meter-deep forereef environment slopes up to a shallow lagoon partially separated by a fringing reef crest and channel. Mechanical systems simulate or substitute for natural environmental processes. Physical and chemical parameters such as temperature, mixing, gas exchange, nutrient concentrations, and partial pressure of CO2 can be independently manipulated. The Biosphere 2 Ocean is ideal for testing models of chemical or biological changes on coral reefs.
In 1996 Columbia University conducted an experiment to measure the rates of photosynthesis and calcification for three time periods in the system: one corresponding to full glacial time (CO2 = 200µatm, CO3 = 355 µmol/kg, pH 8.29), a second to the present day conditions (CO2 = 360 µatm, CO3 = 241 µmol/kg, pH = 8.08) and a third to conditions predicted for the 22nd Century (CO2 = 900µatm, CO3 = 174 µeq/kg pH = 7.89). These conditions were alternated at 3-month intervals over a three year period. Results from Langdon et al (2000) have shown that rates of coral skeleton calcification decline by 40 % under seawater carbonate concentrations in equilibrium with atmospheric CO2 projected for the mid-21st Century.
After Columbia University's groundbreaking coral acidification research and a period of neglect, the system started to degrade. The substrate then was overgrown by algae and cyanobacteria and the original fauna have been lost (except for about 2 dozen very hardy fish).
We are now revitalizing the Ocean to rebuild a coral reef ecosystem and test innovative solutions for restoring resilient reefs globally. It will host diverse physical environments for coral reef experiments: a turbulent fore-reef with 6-7m vertical relief; a reef crest and back reef with ~2m relief; and a large 1-2m lagoon with diverse substrates. Light, flow, and chemistry will be maintained by a new generation of life support equipment.
The ocean is now being equipped for the addition of corals. Living in the system today are about 60 fish, hermit crabs, urchins, snails, anemones and microorganisms.
Landscape Evolution Observatory (LEO)
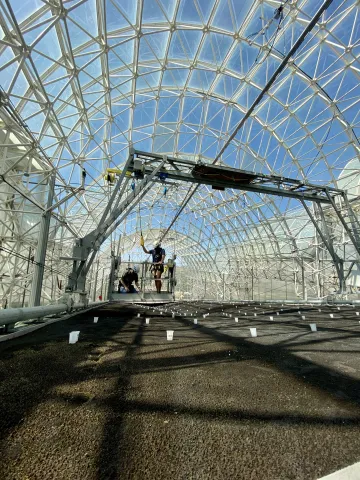
Understanding the process interactions and feedbacks among water, porous geological media, microbes, and vascular plants, is crucial for improving predictions of the response of Earth’s critical zone to future climatic conditions. However, the integrated coevolution of landscapes under change, is notoriously difficult to investigate. Laboratory studies are limited in spatial and temporal scale, while field studies lack observational density and control. To bridge the gap between controlled laboratory and uncontrolled field studies, the University of Arizona built a macrocosm experiment of unprecedented scale: The Landscape Evolution Observatory (LEO) at Biosphere 2. Initial sensor, sampler, and soil-coring data, are providing insights into the linkages between water flow, weathering, and biological community development. These interacting processes drive the model systems to increasingly complex states, potentially perturbed by changes in climatic forcing. By intensively monitoring the evolutionary trajectory, integrating data with mathematical models, and fostering community-wide collaborations, we envision that emergent landscape structures and functions are linked and as significant progress emerges, LEO operations predict the coupled hydro-biogeochemical and ecological responses to global change.
Coastal Fog Desert
Biosphere 2's desert biome was designed to simulate an arid desert scrub ecosystem in a coastal climate with erratic winter rainfall and summer drought. Excessive rain and relatively low evapotranspiration during the initial two-year closure resulted in a dense scrub invaded by grasses. Conversion to a Mediterranean scrub woodland was initiated in 1994, but subsequently climate parameters were changed to simulate more arid conditions. Current management practices are intended to favor arid-adapted species and discourage grasses with C4 photosynthetic pathways.
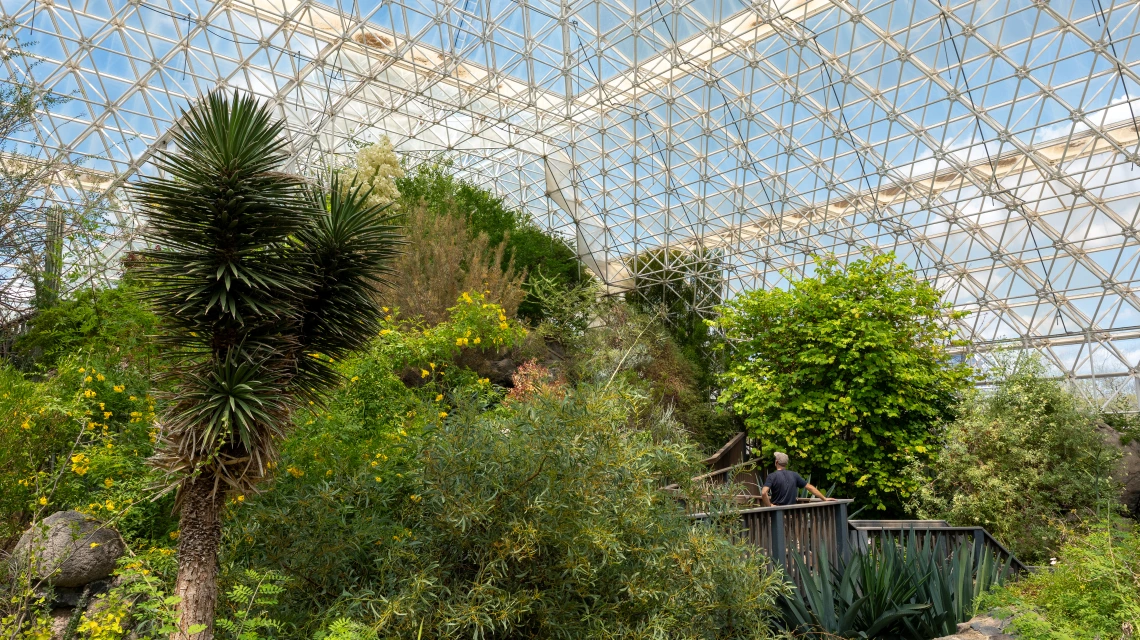
Soils were constructed to simulate those found in arid places ranging from immature dune sand to profiles with clay, carbonate, and salt accumulations. Mini-rhizotron viewing tubes were installed in the dune, to allow periodic observation of root growth and mesofauna. A playa was designed to simulate seasonally flooded areas where salt accumulates. This area has been almost completely overgrown by saltbushes (Atriplex cinerea). A simulated tinaja of artificial rock supports freshwater organisms that can withstand periodic desiccation.
Plant species diversity has declined since assembly, as might be expected. The substantial changes in management goals and climate, together with the loss of pollinating insects, have undoubtedly influenced extinction rates.
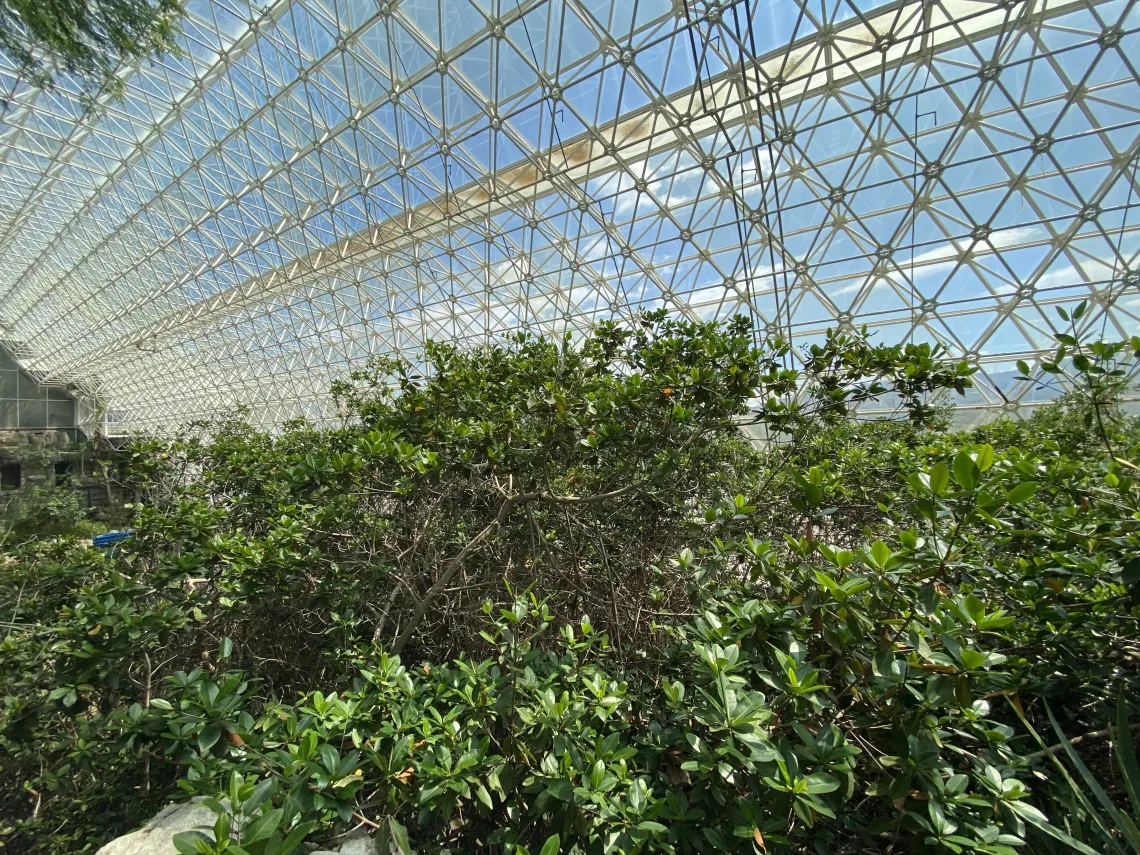
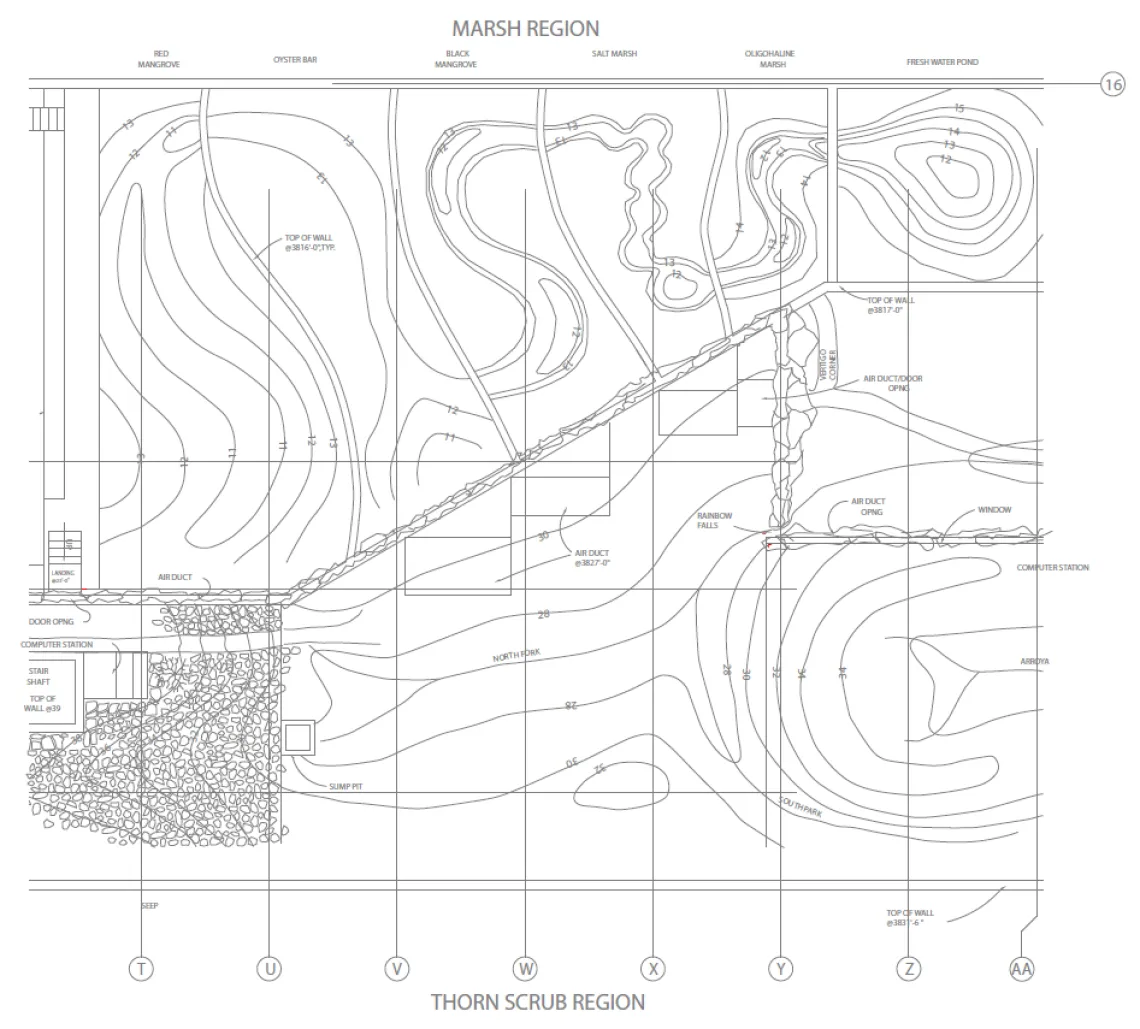
Mangroves
The Mangrove mesocosm is comprised of two major wetland types: 1) a small area of marshes dominated by grass species and 2) forested swamps dominated by mangrove trees, covering 80% of the mesocosm. 542 mangroves and 15 freshwater trees were originally present in the mesocosm’s 441 m2 area. This estuarine model is composed of six adjacent sections. Walls between each section are reinforced with steel rebar and have 0.6 m-wide notches, which permit movement of animals and water between sections. To maximize species diversity, different community types were constructed in each of the six sections.
The upland end of the model is a wetland-ringed Freshwater Pond (59 m2). Taxodium distichum, Annona glabra, Salix caroliniana, and Myrica cerifera are the dominant trees. The Oligohaline marsh (32 m2) is the transitional zone between the freshwater and mangrove sections. Acrostichum danaeifolium, Spartina spartinae, Myrica cerifera, and Laguncularia racemosa are the dominant plants. The Salt Marsh/White Mangrove section (52 m2) signifies the start of the truly marine area. This section is dominated by Rhizophora mangle and Laguncularia racemosa. The Black Mangrove section (72m2) is dominated by Avicennia germinans. The northern two sections, Oyster Bay (91m2) and Fringing Red Mangrove (129m2), are dominated by Rhizophora mangle trees (Finn, 1996).
The marsh system was colonized with, including crawfish, snails, mosquito fish, sailfin mollies, mudcrabs, fairy shrimp, mangrove crabs, killifish, amphipods, sponges, anemones, and snapping shrimps. There has been a decline in faunal diversity, perhaps caused by biotic closure effects and absence of tides.
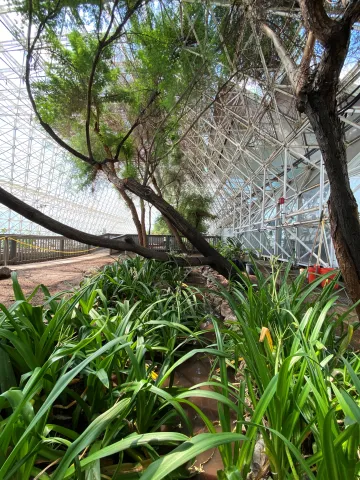
Savanna
The savanna biome was designed to perform several different functions within Biosphere 2. Its primary goal was to provide a hydrological transition zone between the desert and rainforest mesocosms. The objective was to learn how to balance atmospheric chemistry by varying hydrological regimes within the tropical mesocosms. The savanna was to be a scaled-down model of tropical savannas, both duplicating ecosystem processes in savannas and capturing essential features of biodiversity and aesthetics. Vegetation zones within the savanna mesocosm were created primarily from edible species, including acacias for galagos, large-seeded grasses for finches, and fruit-bearing trees for galagos and birds.
The savanna is divided into four major regions: Quartzite Slope, Upper Savanna, Granite Slope, and Lower Savanna. The northernmost section of the savanna consists of a quartzite slope made from quartzite boulders. The savanna stream waterfall is located in this area. The Upper Savanna has three sections of vegetation. The section adjacent to the stream is composed of fresh-water wetland species from the Florida Everglades including Cornus foemina, Typha domingensis, Salix caroliniana, Crinum americanum, Ludwigia octovalvis, and Cladium jamaicense. The Gallery Forest section is dominated by Acacia species with a rather sparse grass understory. Typical grass species in the gallery forest include Andropogon gayanus, Panicum maximum, Paspalum guenoarum, Setaria poiretiana, and the invasive Brachiaria mutica. Billabongs are depressions in the Upper Savanna. They were designed to be periodically flooded to produce a hyperseasonal habitat. Hyperseasonal environments alternate between waterlogged and desiccated conditions, which kill most trees and thereby favor grasses. The billabongs are dominated by a grass canopy of Brachiaria mutica and Chloris gayana, with patches of twining Vigna luteola and Macroptilium lathyroides vines.
The Lower Savanna is southernmost, next to the Upper thornscrub. It is dominated by Brachiaria mutica. Other grasses in this area are Dichanthium annulatum, Cenchrus setigerus, Panicum maximum, Sorghum halepense, and Brachiaria decumbens.